


Data & Analytics Workflow for Clinicians
HEALTH DATA INSTITUTE
I have the spreadsheet; Now what?
We plan to create a Real World Health Data Repository (RWHDR) in the Trust's cloud. This will be a collection of HES data, ONS mortality statistics and a digital twin of our EPR.Clinicians are not used to processing large data sets. Currently RWHDR data cannot be extracted with the same ease as a Medline or Google Scholar search. We aim to change this. We will have to encourage clinicians to move away from Accounting solutions (MS Excel) and adopt data science, cloud-based platforms like Google Colab. There is a data & analytics workflow that clinicians might want to adopt - see Figure 1. It is possible in Python to import a large csv file and, with just 3 lines of code, summarise the entire contents quickly.
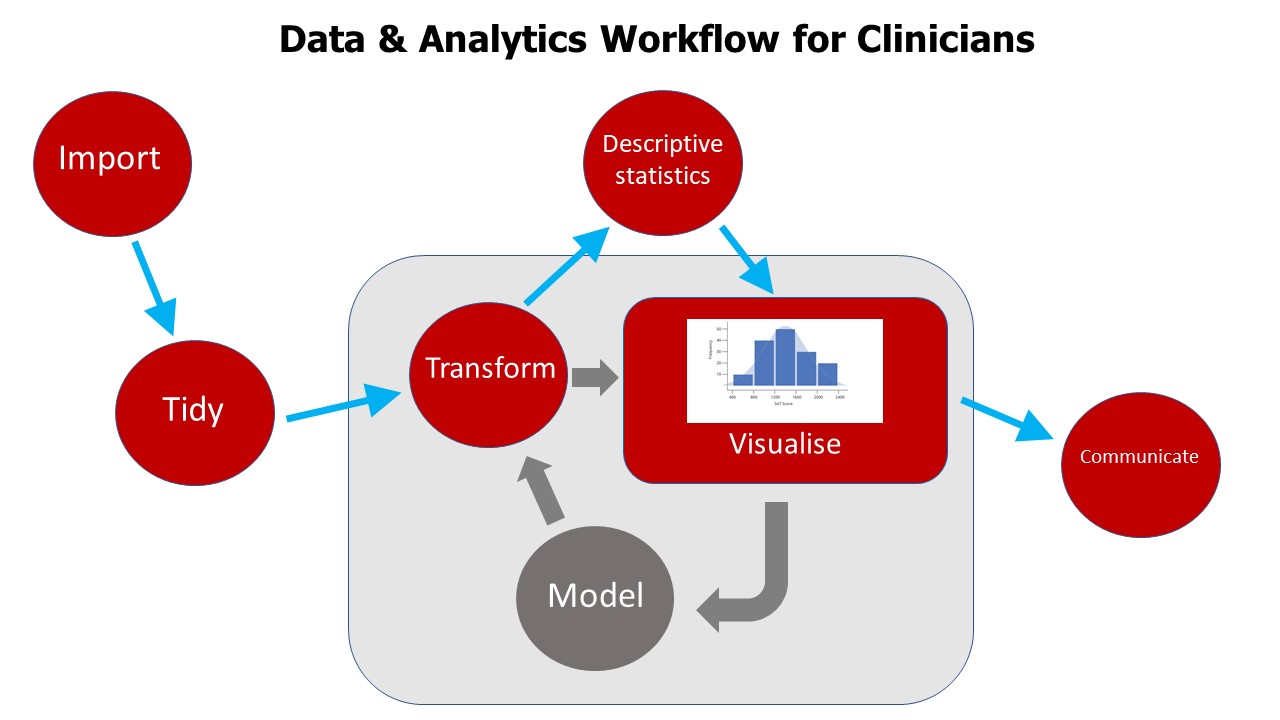
For most searches, most clinicians will not want to model their data. They simply want some descriptive statistics, a few decent charts to visualise the findings and then a way to get tables and charts into a slide or MS Word document. This is particularly true for audit.
Data & Analytics Workflow
- Import: Large csv data files are brought into Colab for processing.
- Tidy: Wrangle the dataset into a dataframe of columns (with the first row as variable labels) and rows. The output from EPR queries is already in this format. However Hospital Episode Statistics (HES) data in the public domain is horribly untidy.
- Transform: This is the process of selecting (variables), filtering and arranging rows and creating new variables from the existing ones.
- Descriptive statistics: These include counts and ranges, means, standard deviation, variance and so on.
- Visualise: This process represents the data visually in tables, histograms, time series and box plots
- Communicate: This is the final output using the data in presentations and publications.
Modelling
By contrast, the academic clinician may want to model data in Google Colab to produce linear regression, logistic regression, chi-squared, t-test, odds ratio and so on. Modelling is the process by which order is imposed on real world data using powerful algorithms. Often to make the model accurately reflect the real world, there is usually a list of assumptions that have to be met first - linear regression is a great example of this. Once the model is built, it is used to predict outcomes in the future.
Data can also be modelled using the new statistics of Machine Learning (ML) such as support vector machines and random forest. However, the latter two would probably be best done in collaboration with our data science colleagues.
Sign up for a free Google Colab account and welcome to the data science era!

Health Data Institute
Digital, Data and Technology division
Royal Berkshire NHS Foundation Trust
Princes House
73a London Road
Reading, RG1 5UZ
Email us at healthdatainstitute@royalberkshire.nhs.uk
© 2022 - 2026 Health Data Institute
all rights reserved